 file
file- go-internals
- Go-Questions
- golang101
- golangbot
- gomod-conflict-detect
- html2md
- images
- img
- istio源码分析
- Jaeger源码分析
- nsq源码分析
- watermelo
- 源码分析
 awesome.md
- bugs.md
- build-a-installsuffix.md
- cgo.md
- client-go.md
- context.md
- CPU-cache.md
- CPU性能内存分析调试方法大汇总.md
- defer.md
- DNS.md
- enum.md
- error.md
- float.md
- GC-1.md
- GC-20-Questions.md
- Go 编译器内核-给 Go 新增一个语句.md
- go-build-version.md
- go-compile.md
- go-http2.md
- go-mem.md
- go-memory-allocator-visual-guide.md
- go-memory-management.md
- go-mod.md
- go-raft.md
- go-virtual-memory-alloc.md
- go1.15.md
- go2.md
- gocker-docker.md
- GOMAXPROCS.md
- goroutine-channel.md
- Go内存分配器的设计与实现.md
- Go内存详解.md
- go指令.md
- go语言原本.md
- http.md
- k8s-client-1.md
- LeetCode.md
- map.md
- mem-malloc-2.md
- mem-malloc.md
- pprof.md
- readelf-objdump.md
- README.md
- Real-world-advice-for-writing-maintainable-Go-programs.md
- release.md
- scheduler.md
- slice.md
- tostudy.md
- unsafe.md
- 性能.md
- 指针-结构体.md
Table of Contents
[TOC]
Profiling
holmes
WithMemDump(3, 25, 80) 指定进程的mem占用率超过3%后(线上建议设置成30),如果有25%突增,或者总占用率超过80%后进行采样
https://github.com/mosn/holmes
相关参考
static analysis (SAST) tools 静态分析工具
https://github.com/analysis-tools-dev/static-analysis
go-perfbook
https://github.com/dgryski/go-perfbook
本文概述了编写高性能Go代码的最佳实践。
第一节介绍了用任何语言编写优化代码。后面的部分将介绍go特定的技术。
go-profiler-notes
https://github.com/DataDog/go-profiler-notes
gperftools
https://github.com/gperftools/gperftools
采用gperftools 工具集中的CPU profiler 来对C++程序进行性能分析
gperftools 是 Google开源的一款包含 多线程下高性能内存分配器 tcmalloc 实现和 其他性能分析工具的集合。用户可以单独使用其中的某项工具,也可以全部使用。
git clone https://github.com/gperftools/gperftools.git
cd gperftools
mkdir build
cd build
cmake -DCMAKE_INSTALL_PREFIX=/opt/software ..
make -j8
make install
or
# 全部安装(gperftools-devel 是头文件)
yum install -y gperftools gperftools-devel
# 安装依赖
yum install -y libunwind graphviz
# 安装pprof(其本身是一个perl 脚本)
yum install -y pprof
Profiling相关库
pyroscope/性能监控
https://github.com/pyroscope-io/pyroscope
- Ruby (via rbspy)
- Python (via py-spy)
- Go (via pprof)
- Linux eBPF (via
profile.pyfrom bcc-tools) - PHP (via phpspy)
- .NET (via dotnet trace)
- Java (coming soon)
eBPF 是一项革命性的技术,可以在 Linux 内核中运行沙盒程序,而无需更改内核源代码或加载内核模块。通过使 Linux 内核可编程,基础架构软件可以利用现有的层,从而使它们更加智能和功能丰富,而无需继续为系统增加额外的复杂性层。
eBPF 导致了网络,安全性,应用程序配置/跟踪和性能故障排除等领域的新一代工具的开发,这些工具不再依赖现有的内核功能,而是在不影响执行效率或安全性的情况下主动重新编程运行时行为。
statsview
A real-time Golang runtime stats visualization profiler
https://github.com/go-echarts/statsview
parca
https://github.com/parca-dev/parca
启动parca,打开链接,选择profile
profefe
https://github.com/profefe/profefe
fgprof
https://github.com/felixge/fgprof
go-torch
https://github.com/uber/go-torch
使用go-torch来生成golang程序的火焰图
go-torch -alloc_space http://127.0.0.1:8080/debug/pprof/heap --colors=mem
go-torch -inuse_space http://127.0.0.1:8080/debug/pprof/heap --colors=mem
火焰图的含义
火焰图(FlameGraph)是 svg 格式的矢量图
-
纵向(Y 轴)高低不平,表示的是函数调用栈的深度。每一层都是一个函数。调用栈越深,火焰就越高,顶部就是正在执行的函数,下方都是它的父函数。
-
横向(X 轴)表示该函数执行消耗的时间,横向上会按照字母顺序排序,而且如果是同样的调用会做合并(注意:如果一个函数在 X 轴占据的宽度越宽,就表示它被抽到的次数多,即执行的时间长,所以这里不是严格意义上的执行消耗的时间),所以一个横向宽度越大的函数调用,一般很可能是程序的瓶颈。
x 轴表示抽样数,如果一个函数在 x 轴占据的宽度越宽,就表示它被抽到的次数多,即执行的时间长。注意,x 轴不代表时间,而是所有的调用栈合并后,按字母顺序排列的。 -
火焰图的颜色是随机分配的,并不是颜色越深就是越瓶颈。因为火焰图表示的是 CPU 的繁忙程度,所以一般都是暖色调。我们需要留意的就是那些比较宽大的火苗。只要有"平顶",就表示该函数可能存在性能问题。
火焰图就是看顶层的哪个函数占据的宽度最大。只要有"平顶"(plateaus),就表示该函数可能存在性能问题。
如何读懂火焰图?
trace
单单使用 PProf 有时候不一定足够完整,因为在真实的程序中还包含许多的隐藏动作,例如 Goroutine 在执行时会做哪些操作?执行/阻塞了多长时间?在什么时候阻止?在哪里被阻止的?谁又锁/解锁了它们?GC 是怎么影响到 Goroutine 的执行的?这些东西用 PProf 是很难分析出来的,但如果你又想知道上述的答案的话,你可以用 go tool trace 。
不合适
- 运行缓慢的函数,或者找到大部分CPU时间花费在哪里,术业有专攻,看CPU时间花费,是有专门的工具的
go tool pprof
合适
- 找出程序在一段时间内正在做什么
go tool trace可以通过 view trace链接提供的其他可视化功能,对于诊断争用问题帮助极大
参考
https://blog.csdn.net/u013474436/article/details/105232768
https://zhuanlan.zhihu.com/p/377145725
https://pkg.go.dev/cmd/trace#section-documentation
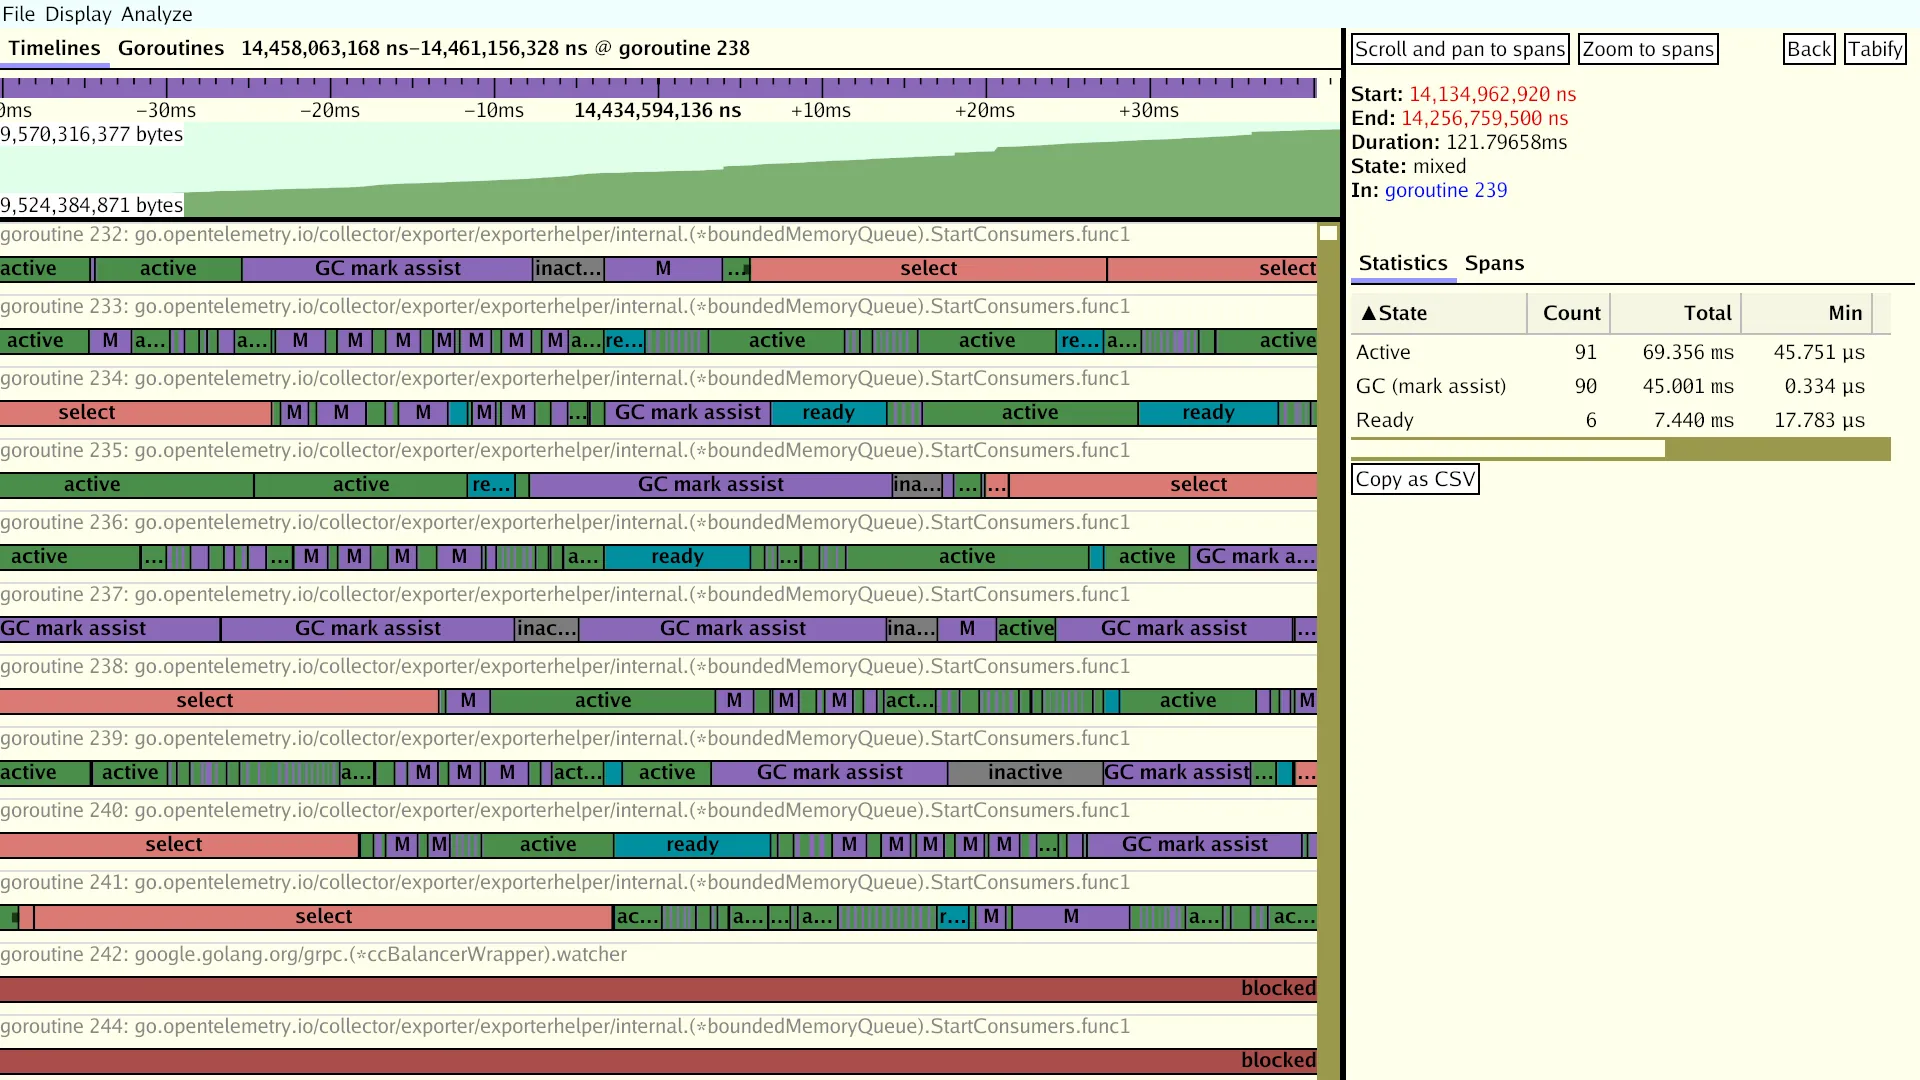
gotraceui
https://gotraceui.dev/
https://github.com/dominikh/gotraceui
pprof
https://github.com/google/pprof
深度解密Go语言之 pprof
https://github.com/golang/go/wiki/Performance
https://go.dev/doc/diagnostics
goroutine    - stack traces of all current goroutines
heap         - a sampling of memory allocations of live objects
allocs       - a sampling of all past memory allocations
threadcreate - stack traces that led to the creation of new OS threads
block        - stack traces that led to blocking on synchronization primitives
mutex        - stack traces of holders of contended mutexes
BlockProfile和MutexProfile需要设置采集频率才能采集到数据,因为它们默认不采集,相关文档如下:
$ go doc runtime.SetBlockProfileRate

$ go doc runtime.SetMutexProfileFraction
MemoryProfile频率也是可以设置的(默认是开启的,因此可以不动),同时GODEBUG=memprofilerate=X也可以控制这个参数:
$ go doc runtime.MemProfileRate
自测试testing
我们可以先使用go test 内置的参数生成pprof数据,然后借助go tool pprof/go-torch来分析。
生成cpu、mem的pprof文件(相关flag)
go test -bench=BenchmarkStorageXXX -cpuprofile cpu.out -memprofile mem.out
此时会生成一个二进制文件和2个pprof数据文件,例如
storage.test cpu.out mem.out
然后使用go-torch来分析,二进制文件放前面
#分析cpu
go-torch storage.test cpu.out
#分析内存
go-torch --colors=mem -alloc_space storage.test mem.out
go-torch --colors=mem -inuse_space storage.test mem.out
go test -cpuprofile=cpu.out
go test -blockprofile=block.out
go test -memprofile=mem.out
CPU profile:报告程序的 CPU 使用情况,按照一定频率去采集应用程序在 CPU 和寄存器上面的数据
Memory Profile(Heap Profile):报告程序的内存使用情况
Block Profile:报告导致阻塞的同步原语的情况,可以用来分析和查找锁的性能瓶颈
Goroutine Profile:报告 goroutines 的使用情况,有哪些 goroutine,它们的调用关系是怎样的
-benchmem
    Print memory allocation statistics for benchmarks.

-blockprofile block.out
    Write a goroutine blocking profile to the specified file
    when all tests are complete.
    Writes test binary as -c would.

-blockprofilerate n
    Control the detail provided in goroutine blocking profiles by
    calling runtime.SetBlockProfileRate with n.
    See 'go doc runtime.SetBlockProfileRate'.
    The profiler aims to sample, on average, one blocking event every
    n nanoseconds the program spends blocked. By default,
    if -test.blockprofile is set without this flag, all blocking events
    are recorded, equivalent to -test.blockprofilerate=1.

-cpuprofile cpu.out
    Write a CPU profile to the specified file before exiting.
    Writes test binary as -c would.

-memprofile mem.out
    Write an allocation profile to the file after all tests have passed.
    Writes test binary as -c would.

-memprofilerate n
    Enable more precise (and expensive) memory allocation profiles by
    setting runtime.MemProfileRate. See 'go doc runtime.MemProfileRate'.
    To profile all memory allocations, use -test.memprofilerate=1.

-mutexprofile mutex.out
    Write a mutex contention profile to the specified file
    when all tests are complete.
    Writes test binary as -c would.

-mutexprofilefraction n
    Sample 1 in n stack traces of goroutines holding a
    contended mutex.
go test时产生trace
$ go test -trace=trace.out pkg

-trace trace.out
    Write an execution trace to the specified file before exiting.
详细
gops 分析机器上运行了哪些go进程
https://shockerli.net/post/golang-tool-gops/
godebug:一个跨平台的Go程序调试工具
go tool trace
查看运行时间,详细
/usr/bin/time -v go run test2.go
go tool pprof -http=:1234 http://10.244.28.10:8080/debug/pprof/profile?seconds=30
go tool pprof -http=:1234 http://10.244.28.10:8080/debug/pprof/allocs?seconds=30
- 分析工具:GODEBUG
- 分析工具:go tool pprof
- 分析工具:go tool trace
好东西 - 性能优化
堆的信息
go tool pprof -http :9090 http://ip:port/debug/pprof/heap
cpu(CPU Profiling): \(HOST/debug/pprof/profile,默认进行 30s 的 CPU Profiling,得到一个分析用的 profile 文件 block(Block Profiling):\)HOST/debug/pprof/block,查看导致阻塞同步的堆栈跟踪
goroutine:\(HOST/debug/pprof/goroutine,查看当前所有运行的 goroutines 堆栈跟踪 heap(Memory Profiling): \)HOST/debug/pprof/heap,查看活动对象的内存分配情况
mutex(Mutex Profiling):\(HOST/debug/pprof/mutex,查看导致互斥锁的竞争持有者的堆栈跟踪 threadcreate:\)HOST/debug/pprof/threadcreate,查看创建新OS线程的堆栈跟踪
pprof可以比较两个时间点的分配的内存的差值
-
首先确保你已经配置了 pprof 的 http 路径, 可以访问
http://ip:port/debug/pprof/查看(如果你没有修改默认的 pprof 路径) -
导出时间点 1的堆的 profile:
curl -s http://127.0.0.1:8080/debug/pprof/heap > base.heap, 我们把它作为基准点 -
喝杯茶,等待一段时间后导出时间点 2的堆的 profile:
curl -s http://127.0.0.1:8080/debug/pprof/heap > current.heap -
现在你就可以比较这两个时间点的堆的差异了:
go tool pprof --base base.heap current.heap -
使用web命令会生成一个 SVG 文件,可能你需要使用浏览器打开它。
或者你直接使用命令打开 web 界面: go tool pprof --http :9090 --base base.heap current.heap。
通过比较差值,就容易看到哪些地方产生的内存"残留"的比较多,没有被内存释放,极有可能是内存泄漏的点。
go tool pprof -inuse_space http://127.0.0.1:9999/debug/pprof/heap。输入top10可以看出前十占用内存情况,这里我是直接输入png导出图片来查看,以便以后比较。还有两个参数可以选择,-inuse_space顾名思义是正在使用的内存,-alloc_space是已经分配的内存,本次我是一直用-inuse_space进行分析。
go tool pprof http://localhost:6060/debug/pprof/profile?seconds=60
执行该命令后,需等待 60 秒(可调整 seconds 的值),pprof 会进行 CPU Profiling。结束后将默认进入 pprof 的交互式命令模式,可以对分析的结果进行查看或导出。
go tool pprof -svg http://localhost:8080/debug/pprof/heap > cpu.svg
安装 Graphviz
https://graphviz.gitlab.io/_pages/Download/Download_windows.html
go tool pprof --http :9090 http://localhost:8080/debug/pprof/heap
方法一:
$ go tool pprof -http=:8080 cpu.prof
方法二:
$ go tool pprof cpu.prof
$ (pprof) web
另一种可视化数据的方法是火焰图,需手动安装原生 PProf 工具:
(1) 安装 PProf
$ go get -u github.com/google/pprof
(2) 启动 PProf 可视化界面:
$ pprof -http=:8080 cpu.prof
(3) 查看 PProf 可视化界面
打开 PProf 的可视化界面时,你会明显发现比官方工具链的 PProf 精致一些,并且多了 Flame Graph(火焰图)
它就是本次的目标之一,它的最大优点是动态的。调用顺序由上到下(A -> B -> C -> D),每一块代表一个函数,越大代表占用 CPU 的时间更长。同时它也支持点击块深入进行分析!
go tool trace trace.out
	f, _ := os.Create("trace.out")
	defer f.Close()
	trace.Start(f)
	defer trace.Stop()
也可以输出到 标准错误
import (
	"os"
	"runtime/trace"
)

func main() {
	trace.Start(os.Stderr)
	defer trace.Stop()

	ch := make(chan string)
	go func() {
		ch <- "EDDYCJY"
	}()

	<-ch
}
生成跟踪文件:( 2> 就是Stderr)
$ go run main.go 2> trace.out
当然pprof中也有
curl http://127.0.0.1:6060/debug/pprof/trace?seconds=20 > trace.out
go tool trace trace.out
也可以写入文件
golang 的性能分析库在 runtime/pprof 里,主要提供下面几个接口
// 堆栈分析
func WriteHeapProfile(w io.Writer) error
// cpu分析
func StartCPUProfile(w io.Writer) error
方法1
var cpuprofile = flag.String("cpuprofile", "", "write cpu profile to file")

func main() {
    flag.Parse()
    if *cpuprofile != "" {
        f, err := os.Create(*cpuprofile)
        if err != nil {
            log.Fatal(err)
        }
        pprof.StartCPUProfile(f)
        defer pprof.StopCPUProfile()
    }
…
https://github.com/hatlonely/easygolang/blob/master/pprof/pprof.go
参考
Go Execution Tracer设计文档
Go应用诊断
Go tool trace介绍
Go execution tracer
go tool trace
具体问题
优化建议
-
小对象合并
对象合并成更大的对象。比如,使用 bytes.Buffer 代替 *bytes.Buffer 结构(后面你可以通过调用 bytes.Buffer.Grow 预先分配 buffer )。这将降低内存的分配数量(更快),同时降低垃圾回收器的压力(更快的垃圾回收)。 -
局部变量逃逸时,将其聚合起来
for k, v := range m {
	k, v := k, v   // copy for capturing by the goroutine
	go func() {
		// use k and v
	}()
}
可以修改为:
for k, v := range m {
	x := struct{ k, v string }{k, v}   // copy for capturing by the goroutine
	go func() {
		// use x.k and x.v
	}()
}
修改后,逃逸的对象变为了x,将k,v2个对象减少为1个对象。
这会把两个内存分配变为一个内存分配。尽管如此,该优化会影响代码的可读性,所以请合理使用它。
解读pprof报告
内存不归还系统
package main

import (
	"fmt"
	"runtime"
	"runtime/debug"
	"time"
)

func main() {

	go func() {
		var a []int
		for i := 0; i < 2000; i++ {
			a = make([]int, i*100000)
		}
		a = nil
		fmt.Printf("%v\n", a)
	}()

	go func() {
		for {
			m := runtime.MemStats{}
			d := debug.GCStats{}
			runtime.ReadMemStats(&m)
			debug.ReadGCStats(&d)
			fmt.Printf("%v\t%v\t%v\n", d.NumGC, m.HeapIdle/1024/1024, m.HeapInuse/1024/1024)
			time.Sleep(time.Second)
		}
	}()
	for {
		runtime.GC()
		time.Sleep(time.Second)
	}

}
package main

import (
    "fmt"
    "runtime"
    "runtime/debug"
    "time"
)

func main() {
    var a []int
    for i := 0; i < 200; i++ {
        a = make([]int, i*100000)
    }
    a = nil
    fmt.Printf("%v\n", a)
    for {
        m := runtime.MemStats{}
        d := debug.GCStats{}
        runtime.ReadMemStats(&m)
        debug.ReadGCStats(&d)
        fmt.Printf("%v\t%v\t%v\n", d.NumGC, m.HeapIdle/1024/1024, m.HeapInuse/1024/1024)
        time.Sleep(time.Second)
    }
}
https://www.cnblogs.com/luckcs/articles/4107647.html
package main

import (
    "fmt"
    "math/rand"
    "runtime"
    "time"
)

func makeBuffer() []byte {
    return make([]byte, rand.Intn(5000000)+5000000)
}

func main() {
    pool := make([][]byte, 20)

    var m runtime.MemStats
    makes := 0
    for {
        b := makeBuffer()
        makes += 1
        i := rand.Intn(len(pool))
        pool[i] = b

        time.Sleep(time.Second)

        bytes := 0

        for i := 0; i < len(pool); i++ {
            if pool[i] != nil {
                bytes += len(pool[i])
            }
        }

        runtime.ReadMemStats(&m)
        fmt.Printf("%d,%d,%d,%d,%d,%d\n", m.HeapSys, bytes, m.HeapAlloc,
            m.HeapIdle, m.HeapReleased, makes)
    }
}